Gold has shown in recent years that it can continue to grow and reach new historical peaks, even in an environment of high interest rates.
Of course, high interest rates themselves are the result of excessively high inflation, which supported demand for investment gold.
Now, with inflation falling and central banks cutting rates or preparing to cut them, the question arises whether gold will be able to continue to grow and reach new historical peaks, far removed from current levels. Is gold ready for further growth, considering the current fundamental situation, upcoming interest rate cuts, the US presidential election and the still tense geopolitical situation in the world?
Extremely low demand does not hinder growth
Looking at data from the second quarter of 2024, it has not been this bad for a long time. Jewellery demand is the lowest since 2020, and demand in general is the lowest since 2021.
In these years, the demand situation was weak, which was related to the economic slowdown during the pandemic. It is worth mentioning that jewellery demand is the backbone of gold demand and often exceeds 50% in a quarter. Looking back to 2010, the average jewellery demand in a quarter was around 550 tonnes, while in the previous quarter it was only 410 tonnes, while the entire demand in a quarter was only 929 tonnes. It usually exceeds 1,000 tonnes per quarter.
This is probably the result of high prices, a strong dollar and economic uncertainty in China. This situation should improve, given the upcoming wedding season in India, and there is no such thing as an Indian wedding without a huge amount of gold. What’s more important, import duties on gold in India are to decrease, which should additionally stimulate demand in the second half of the year.
Although demand looks weak overall, there is probably no reason to worry, even with a huge oversupply, i.e. the difference between supply and demand, which amounted to over 300 tonnes in Q2 of this year.

Gold demand in Q2 2024 looked weak, but it is not a problem for investors. Source: Bloomberg Finance LP, XTB
Investment demand and central banks still look strong
However, it should be noted that demand for physical bars and coins remains strong and, together with demand from central banks, currently constitutes the basis for gold purchases on the market. The share of these two groups is currently over 50%. Central banks have been significantly increasing gold purchases for several years, which is related firstly to uncertainty about the economy and geopolitics, and secondly to the desire to move away from the US dollar.
The dollar is of course the dominant reserve asset in the world, but official institutions want to increase their diversification. One of the largest buyers in the last dozen or so months was the People’s Bank of China, of course after more than 2 years of constant gold purchases, the halt in recent months led to investor uncertainty.
Hence the May correction, which led to a drop from almost 2,500 to 2,300 USD per ounce. It is worth emphasizing, however, that other central banks did not reduce their purchases at all. Surprisingly, the largest player on the gold purchase market is currently the National Bank of Poland. In July, the NBP bought 14 tons of gold and this year’s purchases total 33 tons.
This may not seem like a lot, but Poland is second only to Turkey in this respect, which, however, occasionally sells gold in order to obtain funds to stabilize its currency, which is constantly losing due to extremely high inflation. Are the NBP’s actions preparing for more difficult times? It is rather a desire to diversify and achieve a 20% share of gold in reserves. Currently, it is close to 15%, while in the middle of last year it was 10%.
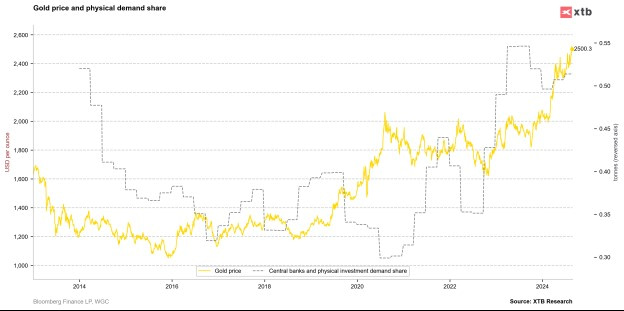
The share of physical investment demand and demand from central banks in the overall demand is over 50%. Source: Bloomberg Finance LP, XTB
ETF funds are preparing for purchases
It is worth mentioning that the first gold ETF funds were created around 20 years ago. Since then, investors do not have to buy gold in bars or coins to enjoy the investment attributes that gold offers. And there are quite a few of them, taking into account, among other things, diversification or the desire to limit the volatility of the investment portfolio.
Buying a gold ETF fund is a kind of self-fulfilling prophecy: buying an investment unit generates the need for the fund to buy physical gold. This in turn means that there is less gold available on the market, so it causes prices to rise. Of course, it is difficult to say unequivocally whether investors are reacting to increases in gold prices and buying fund units, or whether gold is gaining because funds are buying gold.
Either way, the correlation is positive. We have had exceptions to the rule in the last 2-3 years – gold ETFs have been selling gold, but at the same time we have observed a very broad consolidation in gold, and the growth from last year continued despite further sell-off by funds. Nevertheless, a historical relationship can be seen – investors buy gold ETF units when interest rates are cut, and this moment will come very soon.
If ETFs were to return to the record amount of gold held, i.e. approx. 110 million ounces, from the current 82 million ounces, it would mean that demand on the market would be around 800 tons. This could clearly reverse the recent situation of oversupply.
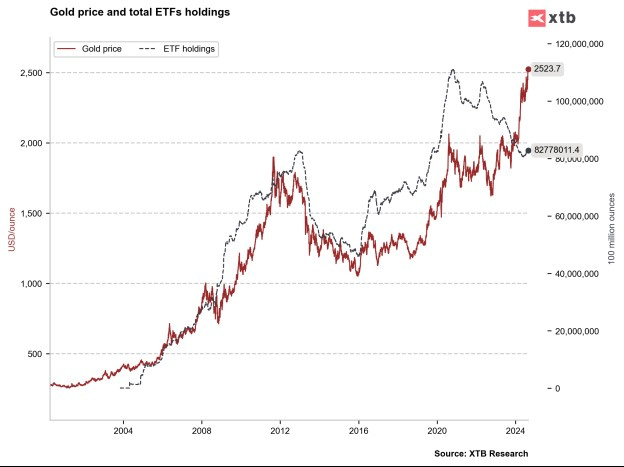
ETFs are returning to gold purchases. Source: Bloomberg Finance LP, XTB
Are rate cuts a clear direction for gold?
Lower interest rates obviously mean more money on the market. More money on the market means the possibility of higher inflation, but gold cannot be printed. Its amount is finite, and annual extraction usually grows slower than the amount of money on the market. This means that in the long term gold should become more expensive.
Looking at the behavior of gold prices before and after the first interest rate cut by the Fed in the last 40 years, the direction is basically clear. Gold gained on average around 20% for two years after the first cut. Looking at this history, only in one case after two years did we have a loss, but it did not exceed 10%.
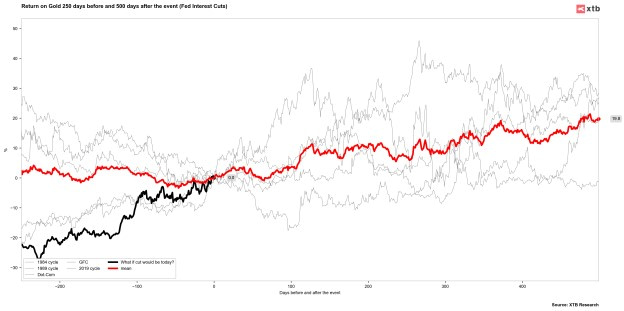
Comparison of gold’s behavior during previous cycles of interest rate cuts by the Fed. Source: Bloomberg Finance LP, XTB
However, leaving aside the cut cycles, what does seasonality look like? The current increases since the beginning of this year are quite large and amount to around 20%. Looking at the 5-, 10-year average behavior of gold prices and long-term behavior (since the 1950s), gold gained for most of the year.
However, there is a certain slump in September. Where could this be due? Investors are returning to the market from vacation, portfolios are rebalanced, in August very often historical peaks were noted for gold, which later led to a correction, and additionally in September important decisions were usually made by the Fed. Although the market clearly indicates a cut, it is already fully priced in by the market. This gives a probability of up to 33% for a double 50 basis point cut. In such a case, profit-taking after the Fed’s September decision cannot be ruled out, and seasonality predicts such a move.
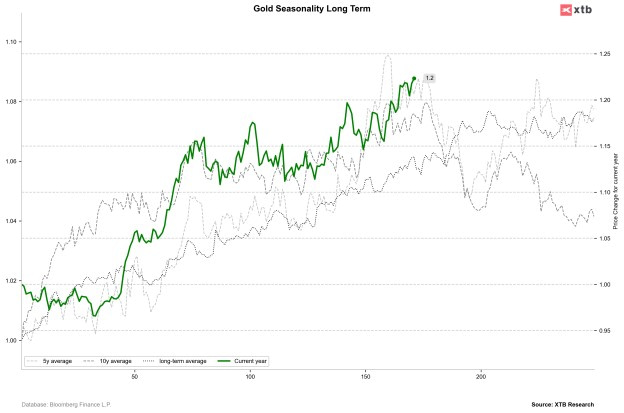
The average performance of gold over the last 5 and 10 years indicates a possible correction and a local bottom in early November. On the other hand, long-term seasonality indicates a continuation of growth and a local peak in November, and then in December. Source: Bloomberg Finance LP, XTB
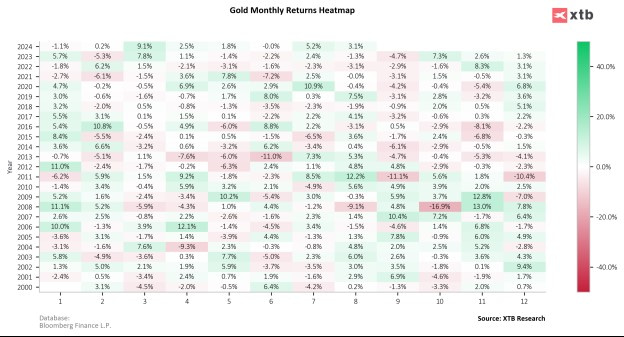
Looking at the changes in individual months, it is clear that gold has been losing in September almost continuously since 2013, and the following two months were also not the best. Seasonally, the best months in recent years have definitely been December and January. Source: Bloomberg Finance LP, XTB
What’s next for gold? Are we expecting more records?
The year 2024 is quite specific. We have a presidential election in the US and although election history does not give us a clear answer as to what direction the precious metals market should take, the policies of both candidates may lead to further increases.
Trump’s actions towards tariffs may lead to higher inflation. Of course, this is a risk of higher rates, but recent years have shown gold’s resistance to high rates. In turn, Harris’ ambitious spending plan may lead to further debt, which may lead to global reluctance to the US dollar.
Although gold is currently at historic highs, its long-term prospects remain positive. Inflation has certainly fallen, but it remains elevated, which will generate further investment demand. The same will be true for central banks. ETFs are returning to buying, and investors in the over-the-counter market, futures and options are indicating very clear confidence in further solid gains.
Of course, a correction or profit-taking cannot be ruled out, but in the long term gold will still look good and can protect against volatility in other assets. Especially when we have such a heavily overbought stock market, which may not be ready to continue beating market expectations in relation to results as much as it has in the last few years. Will we see $3,000, $4,000 or maybe $5,000 in the coming years? Looking at how other commodities have moved, such as copper, oil and even cocoa, double or triple increases are not at all impossible.

The gold market hasn’t seen a correction of more than 10% for a long time, but looking at the price behavior from 2008-2011, there was no major correction then either, and it was a period when interest rates were being lowered. Source: xStation5





Leave a Comment